Google Analytics KPIs: The Ultimate Guide to Metrics That Drive Business Growth

Every day, millions of business owners log into Google Analytics and get overwhelmed by endless data points with no clear next step. More metrics don’t equal better insights or stronger business decisions.
A Key Performance Indicator (KPI) in Google Analytics is a measurable value that shows how effectively your business is achieving its main objectives. The difference between drowning in data and driving real growth comes down to tracking the right Google Analytics KPIs, not just more metrics.
In this article, we’ll cut through the noise and give you a clear framework for identifying, tracking, and reporting on the most important Google Analytics KPIs for your specific goals using GA4. Follow this guide to build your own framework, or see how our digital strategy experts can create custom-built dashboards for you.
Key Takeaways:
- Choose KPIs that map to revenue, not vanity metrics – focus on metrics like conversion rate and average purchase revenue that directly connect to business outcomes rather than impressive-looking but meaningless numbers.
- Configure GA4 for engagement you can act on – track events, scroll depth, and micro-conversions that reveal user intent and predict future purchase behavior for optimization opportunities.
- Use KPI dashboards for weekly decisions, not monthly reporting theater – build focused dashboards that drive immediate action rather than comprehensive reports that overwhelm with data.
- Great strategic KPIs flow from core business objectives – start with revenue goals, identify specific targets, then choose the exact GA4 metrics that measure progress toward those outcomes.
- Segmentation uncovers KPI insights: Segmentation brings your KPIs to life by showing who is driving performance and why results look the way they do by turning raw metrics into actionable insights.
Table of Contents
- What is a KPI in Google Analytics?
- How to Choose the Right KPIs for Your Business
- Top 4 Acquisition KPIs to Track in Google Analytics
- Top 5 Behavior & Engagement KPIs to Track in Google Analytics
- Top 5 Conversion KPIs to Track in Google Analytics
- How to Build a Custom KPI Dashboard in GA4
- Segmentation: The Key to Unlocking KPI Insights
- Frequently Asked Questions
What is a KPI in Google Analytics?
A KPI in Google Analytics is a measurable value that shows how effectively your business is achieving its main objectives. While Google Analytics tracks hundreds of different metrics, only a select few qualify as true KPIs in Google Analytics for your business.
The Critical Difference: Metrics vs. KPIs
Think of your car’s dashboard. It displays many metrics like RPM, oil pressure, and engine temperature. But the KPIs are speed and fuel level because they tell you if you’re achieving your goal of getting to your destination on time.
The same principle applies to your website:
- “Users” is a metric that tells you how many people visited
- “User Conversion Rate” is a KPI that tells you how well your site turns visitors into customers
- “Page Views” is a metric showing traffic volume
- “Revenue per User” is a KPI showing business impact
Why KPIs in Google Analytics Matter for Your Business
Tracking the right KPIs transforms your decision-making process. Instead of guessing which marketing channels work best, you’ll know exactly where to invest your budget. Instead of wondering if your website changes improve performance, you’ll have concrete proof of what drives revenue growth. This is exactly why investing in SEO strategy requires measuring the right metrics from day one.
How to Choose the Right KPIs for Your Business (Before You Even Open GA4)
Choosing the right KPIs involves starting with your business objectives and working backward to identify the specific metrics that measure progress toward those goals. This strategic approach ensures every KPI you track directly connects to business outcomes that matter.
The 3-Step KPI Selection Framework
1. Define Your Business Objectives: Start with what you’re trying to achieve. Common objectives include increasing online sales, generating more qualified leads, or boosting brand engagement.
2. Identify Goals for Each Objective: Break down how you’ll achieve each objective. For “increase online sales,” your goals might include “increase average order value” or “reduce cart abandonment rate.”
3. Select KPIs to Measure Each Goal: Choose the specific GA4 metric that tracks progress. For “increase average order value,” your KPI becomes “Average purchase revenue.” For “reduce cart abandonment,” track “Cart-to-purchase rate.”
| Business Objective | Example Goal | Corresponding GA4 KPI |
| Increase Online Sales | Boost average order value | Average purchase revenue |
| Generate More Leads | Improve form completion | Conversion Rate (form_submit) |
| Build Brand Awareness | Increase content engagement | Average Engagement Time |
| Reduce Customer Acquisition Cost | Improve ad efficiency | Cost Per Acquisition |
| Grow SaaS Subscriptions | Increase trial signups | Conversion Rate (sign_up) |
| Improve SaaS Retention | Increase returning users | N-day retention (Explore > Cohort) |
This framework prevents you from tracking meaningless vanity metrics and ensures every KPI supports real business growth. This strategic approach is crucial for success. If you’re feeling overwhelmed by the options, our team can help you define the right KPIs for your unique business goals.
Top 4 Acquisition KPIs to Track in Google Analytics
Acquisition KPIs measure how effectively you are attracting visitors to your website from various channels. These Google Analytics acquisition KPIs reveal which marketing efforts actually bring valuable traffic to your business.
1. Users and New Users
Users represent the total number of unique visitors to your site during a specific timeframe, while New Users counts first-time visitors specifically.
Why It Matters: These metrics indicate your overall reach and audience growth potential. A healthy balance between returning and new users suggests both strong retention and effective acquisition strategies. If users drop, examine traffic sources and content freshness. If new users plateau, expand marketing channels or improve SEO targeting.
How to Find It in GA4: Reports > Acquisition > User acquisition or Traffic acquisition for a channel view
2. Sessions by Channel
Sessions by Channel measures the number of website visits broken down by traffic source, showing whether visitors came from organic search, paid ads, social media, email, or direct visits.
Why It Matters: This KPI reveals which marketing channels drive the most traffic, helping you allocate budget and effort to your highest-performing sources. When sessions drop from a specific channel, investigate campaign performance or algorithm changes. When sessions spike, double down on successful tactics.
How to Find It in GA4: Reports > Acquisition > Traffic acquisition
3. User Conversion Rate (by Channel)
User Conversion Rate by Channel calculates the percentage of users from each traffic source who complete your desired actions, like making a purchase or filling out a contact form.
Why It Matters: High traffic means nothing if it doesn’t convert. This KPI identifies which channels bring visitors most likely to become customers, not just browsers. If conversion rates drop, examine landing page relevance or user experience issues. If rates improve, increase investment in high-converting channels.
How to Find It in GA4: Reports > Acquisition > User acquisition > Add comparison by conversion event
4. Views per User
Views per User measures the average number of pages each visitor views during their session, segmented by traffic source.
Why It Matters: This engagement indicator shows which channels deliver visitors who are genuinely interested in exploring your content and offerings. Low views per user suggest poor content relevance or navigation issues. High views per user indicate engaged traffic worth increased investment.
How to Find It in GA4: Reports > Acquisition > User acquisition > Customize report to add “Views per user” metric (may require report customization rights). If unavailable, use Explore > Free Form and add Views per user.

Top 5 Behavior & Engagement KPIs to Track in Google Analytics
Behavior and engagement KPIs reveal how users interact with your website’s content and features after they arrive. These Google Analytics behavior KPIs show whether your site effectively holds attention and guides visitors toward conversion.
1. Engaged Sessions (and Engagement Rate)
Engaged Sessions counts visits where users spent at least 10 seconds on site, viewed multiple pages, or completed a conversion event.
Why It Matters: GA4’s primary replacement for bounce rate, this metric identifies meaningful interactions versus quick exits. Higher engagement rates indicate content that resonates with your audience. If engagement drops, review content quality and page load speed. If engagement rises, replicate successful content formats across your site.
How to Find It in GA4: Reports > Engagement > Overview or Reports > Engagement > Pages and screens
2. Average Engagement Time
Average Engagement Time measures the duration your site holds a user’s active attention, excluding time spent in other browser tabs.
Why It Matters: Unlike session duration, engagement time tracks actual attention. Longer engagement suggests compelling content that builds trust and moves users closer to conversion. Short engagement times indicate content mismatch or poor user experience. Extended engagement signals content worth expanding or promoting more aggressively.
How to Find It in GA4: Reports > Engagement > Pages and screens
3. Views by Page / Landing Page
Views by Page counts which content receives the most traffic, while Landing Page views reveal where users typically enter your site.
Why It Matters: This KPI identifies your most popular and effective content, helping you understand what attracts and interests your audience most. Declining page views suggest content needs refreshing or promotion. Rising page views indicate content worth expanding into a series or related topics.
How to Find It in GA4: Reports > Engagement > Pages and screens or Reports > Engagement > Landing page (if enabled)
4. Key Event Count (Formerly Goals)
Key Event Count tracks the frequency of specific valuable actions like newsletter signups, video views, or document downloads.
Why It Matters: These micro-conversions indicate user interest and engagement levels, often predicting future purchase behavior and helping you optimize the customer journey. Modern businesses increasingly rely on AI-powered SEO agents to automatically track and optimize these engagement signals. Declining key events suggest user experience issues. Rising key events indicate a successful content strategy.
How to Find It in GA4: Reports > Engagement > Events > Configure custom events as key events
5. Scroll Depth
Scroll Depth measures how far users read down your key pages, typically tracked at 25%, 50%, 75%, and 90% intervals.
Why It Matters: High scroll depth on important pages suggests compelling content that keeps users engaged, while low scroll depth might indicate content that needs improvement. Poor scroll depth signals content restructuring needs. Strong scroll depth indicates content worth promoting more heavily. Note: GA4’s default scroll event fires at 90% only (Enhanced Measurement); capture 25/50/75% with a GTM scroll trigger and map to events.
How to Find It in GA4: Reports > Engagement > Events > scroll
Top 5 Conversion KPIs to Track in Google Analytics
Conversion KPIs are the ultimate bottom-line metrics that directly measure how well your website achieves its most important goals, like generating revenue or leads. These Google Analytics conversion KPIs connect your marketing efforts directly to business outcomes.
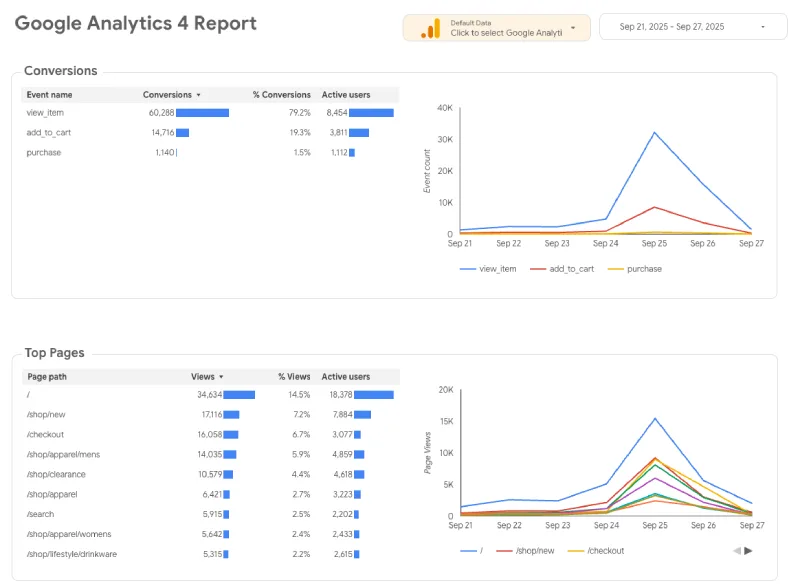
1. Conversions (by Conversion Event)
Conversions measure the total count of your most important actions, such as ‘purchase’ events for e-commerce or ‘generate_lead’ events for service businesses.
Why It Matters: This fundamental KPI measures your website’s primary purpose. Tracking conversions by specific events helps you understand which actions drive the most business value. Declining conversions signal funnel optimization needs. Rising conversions indicate successful marketing tactics worth scaling.
How to Find It in GA4: Reports > Engagement > Conversions
2. Total Revenue
Total Revenue calculates the complete monetary value generated through your website during a specific timeframe.
Why It Matters: Revenue is the top-line KPI for any business that sells products or services online. This metric directly connects your digital marketing efforts to financial results. When revenue drops, Search Impression Share helps pinpoint whether lost visibility, budget limits, or ranking pressure is constraining demand. Revenue drops require immediate funnel analysis and conversion optimization. Revenue growth signals successful strategies worth increased investment.
How to Find It in GA4: Reports > Monetization > Ecommerce purchases
3. Item Purchase-to-View Rate
The Item Purchase-to-View Rate calculates the percentage of product page viewers who complete a purchase for that specific item.
Why It Matters: This KPI reveals how effectively your product pages convert interested browsers into buyers, highlighting opportunities to improve product descriptions, pricing, or calls-to-action. Low purchase-to-view rates suggest product page optimization needs. High rates indicate successful product positioning worth replicating. For page-level analysis, proxy with view_item vs add_to_cart/purchase in Explore.
How to Find It in GA4: Reports > Monetization > Ecommerce purchases > Add comparison with item_view events
4. Average Purchase Revenue
Average Purchase Revenue measures the average monetary value of each transaction completed on your website.
Why It Matters: Increasing average order value often provides more immediate impact than acquiring new customers. This KPI helps you identify upselling and cross-selling opportunities. Declining average purchase revenue suggests pricing pressures or customer behavior shifts. Rising averages indicate successful value-add strategies.
How to Find It in GA4: Reports > Monetization > Ecommerce purchases (labeled as “Purchase revenue per purchase”, often used as AOV proxy)
5. Return on Ad Spend (ROAS)
Return on Ad Spend calculates the revenue generated for every dollar spent on advertising campaigns.
Why It Matters: ROAS directly shows the profitability of your paid marketing efforts, helping you optimize ad spend allocation across channels and campaigns. Low ROAS signals campaign optimization or budget reallocation needs. High ROAS indicates successful ads worth scaling. Note: ROAS varies by attribution model in GA4’s advertising reports.
How to Find It in GA4: Reports > Advertising > Performance (requires Google Ads integration). ROAS appears when Google Ads is linked AND revenue is present; model choice affects values (last-click vs data-driven).

How to Build a Custom KPI Dashboard in GA4
Building a custom KPI dashboard in Google Analytics 4 allows you to see all your most important metrics in one place, saving time and simplifying reporting. Instead of clicking through multiple reports, you’ll have immediate access to track KPIs in Google Analytics that matter most to your business.
Data Prerequisites
Before building your dashboard, ensure your GA4 setup supports accurate KPI tracking:
- Enhanced measurement on (scroll, file_download, site_search)
- Correct event naming (snake_case, consistent)
- Ecommerce tagging complete (view_item, add_to_cart, begin_checkout, purchase)
- Consent Mode v2 / cross-domain configured if applicable (prevents undercounting)
Why Custom Dashboards Beat Default Reports
Default GA4 reports show everything to everyone, but your business needs specific insights. A custom KPI dashboard in Google Analytics focuses on your chosen KPIs, eliminates distracting metrics, and makes sharing results with your team simple and effective.
Step-by-Step Dashboard Creation
- Navigate to Reports > Library in your GA4 interface (requires Admin or Editor permissions)
- Click “Create new report” and choose “Create a detail report”
- Start with a blank template to build exactly what you need
- Add Summary Cards for your top 5-7 KPIs. Suggested cards: Users, New users, Engagement rate, Key events, Conversions, Revenue, ROAS
- Configure each card by selecting the appropriate metric and setting your preferred date range
- Save the report with a descriptive name like “Monthly KPI Dashboard”
- Add to a collection and publish so it appears in the left-hand navigation for your entire team
KPI Governance Framework
Effective KPI tracking requires structure:
- Owner: Assign someone to monitor each KPI weekly
- Cadence: Review core KPIs weekly, comprehensive analysis monthly
- Thresholds: Set alert rules for significant percentage changes (typically 15-20% week-over-week)
- Definition lock: Document exact metric names and report paths to avoid “AOV vs purchase revenue per purchase” confusion
This basic dashboard gives you immediate visibility into performance trends and makes monthly reporting straightforward. While this gets you started, expertly crafted dashboards can give you a single source of truth for all your marketing efforts across multiple platforms.
Segmentation: The Key to Unlocking KPI Insights
Setting up KPIs in Google Analytics 4 gets you halfway there. The real insights come from segmentation, which shows you the “why” behind your numbers.
A KPI like “form completions” might hit your target, but that aggregate number hides the full story. Segment by traffic source and you’ll discover organic search delivers steady conversions while paid social burns budget without results. Break it down by device and you might find desktop users convert at twice the rate of mobile visitors, pointing to a mobile experience problem you can actually fix.
Segmentation transforms your KPIs from progress reports into action plans. Instead of knowing what happened, you’ll know exactly where to focus your optimization efforts for the biggest impact.
Stop Tracking Metrics, Start Measuring Growth
The difference between successful businesses and those stuck in data overwhelm comes down to one simple principle: focus on measuring what matters, not everything that moves.
Remember the framework from this article. Start with your business objectives, identify specific goals, then choose the GA4 KPIs that track progress toward those goals. Pick 3-5 KPIs from our list above and build your first custom dashboard this week.
At Trustworthy Digital, we help businesses transform their Google Analytics data from confusing reports into clear growth strategies. Ready to turn your Google Analytics data into a predictable engine for growth? Schedule a free, no-obligation demo today and let us show you what’s possible.
What's the difference between a metric and a KPI in Google Analytics?
A metric is any measurable data point in GA4, like page views or users. A KPI is a specific metric that directly measures progress toward your business objectives. All KPIs are metrics, but not all metrics are KPIs.
How many KPIs should I track in Google Analytics?
Why did Google Analytics 4 change bounce rate to engagement rate?
Can I track KPIs from other platforms in Google Analytics?
GA4 can import cost data from Google Ads and some other platforms, but for a complete view of cross-platform performance, you need integrated dashboards that combine data from multiple sources like social media platforms and email marketing tools.
How often should I review my Google Analytics KPIs?
Check your core KPIs weekly for trends and monthly for comprehensive analysis. Daily monitoring often shows too much noise, while quarterly reviews miss opportunities for quick optimization.
About the Author: Grace
Grace is a seasoned content strategist and writer with deep expertise in creating digital content that drives measurable business outcomes. She specializes in producing articles, guides, and campaigns that not only attract qualified leads but also improve user experience and strengthen brand authority. With a strong background in SEO and the emerging field of AEO (Answer Engine Optimization), Grace ensures every piece of content is optimized to perform across search engines, AI-driven platforms, and customer journeys. Her approach combines research, storytelling, and strategy—helping brands build trust, increase visibility, and convert readers into loyal customers.
View all posts →